Problem
I noticed a new feature in SQL Server 2008 R2 Reporting Services that allows you to render maps in your reports. Can you provide some details on this new feature and can I take advantage of it even though don't have any spatial columns in my data warehouse?
Solution
SQL Server 2008 introduced new spatial data types including a geography type that can be used to stored latitude and longitude coordinates. The new map feature in SQL Server Reporting Services 2008 R2 works with the geography type as well as with state abbreviations, state names, or state numbers. The built-in map feature allows you to add a map to a report and show the states in the US or the counties within a state. You can use the map to render one or more data points, providing a slick visualization of your data by state or county within a state.
In this tip I will walk through creating a report with a map. As an example I will create a simple report using Business Intelligence Development Studio (BIDS). A preview of the report is shown below:
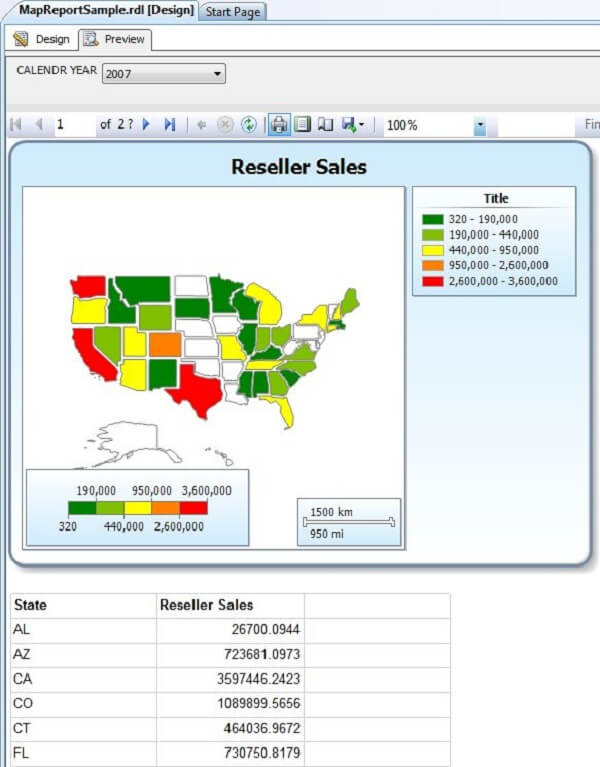 My report will use the AdventureWorksDW2008R2
database and show reseller sales by state. I will use the following
query to retrieve the total reseller sales for a given calendar year by
state:
My report will use the AdventureWorksDW2008R2
database and show reseller sales by state. I will use the following
query to retrieve the total reseller sales for a given calendar year by
state:
To add a map to a report, double click Map from the Toolbox as shown below:.
http://www.mssqltips.com/tip.asp?tip=2174
I noticed a new feature in SQL Server 2008 R2 Reporting Services that allows you to render maps in your reports. Can you provide some details on this new feature and can I take advantage of it even though don't have any spatial columns in my data warehouse?
Solution
SQL Server 2008 introduced new spatial data types including a geography type that can be used to stored latitude and longitude coordinates. The new map feature in SQL Server Reporting Services 2008 R2 works with the geography type as well as with state abbreviations, state names, or state numbers. The built-in map feature allows you to add a map to a report and show the states in the US or the counties within a state. You can use the map to render one or more data points, providing a slick visualization of your data by state or county within a state.
In this tip I will walk through creating a report with a map. As an example I will create a simple report using Business Intelligence Development Studio (BIDS). A preview of the report is shown below:
SELECT g.StateProvinceCode, SUM(f.ExtendedAmount) Sales
FROM dbo.FactResellerSales f
JOIN dbo.DimDate d ON d.DateKey = f.ShipDateKey
JOIN dbo.DimReseller s ON s.ResellerKey = f.ResellerKey
JOIN dbo.DimGeography g ON g.GeographyKey = s.GeographyKey
WHERE d.CalendarYear = @CALENDAR_YEAR
AND g.CountryRegionCode = 'US'
GROUP BY g.StateProvinceCode
http://www.mssqltips.com/tip.asp?tip=2174